| Metric | Value |
|---|---|
| Scheduled sessions | 1,746 |
| Distinct activities | 1,408 |
| Scheduled session hours | 1,828.9 |
| Unique named speakers | 1,281 |
| Organizations, villages, and communities | 126 |
| Distinct tags | 168 |
| Locations | 157 |
| Peak concurrent sessions | 155 |
DEF CON 34 by the Numbers
A schedule snapshot of sessions, communities, people, and places
At a glance
The schedule contains 1,746 scheduled sessions across 1,408 distinct activities. It names 1,281 speakers and 126 organizations, villages, or communities.
Of those scheduled sessions, 338 are additional slots beyond one per distinct activity, representing 19.4% of all scheduled sessions. These repeated slots give attendees another opportunity to attend an activity offered more than once. Among sessions included in the duration analysis, the median scheduled duration is 60 minutes.
The busiest day is Friday, August 07, with 723 scheduled sessions. Peak concurrency reaches 155 simultaneous sessions on Sunday, August 09 at 11:10 AM PDT.
NoteAbout the data
Session counts include all sessions scheduled from August 6 through August 9, 2026. Duration-based metrics and visualizations include sessions longer than zero and no more than 4 hours. Longer entries commonly represent open hours, training, contests, registration, or multi-day activities. Times are shown in Pacific Time.
Distinct activities are calculated using unique content_id values. An activity scheduled multiple times counts as one distinct activity and multiple scheduled sessions.
Built from the Hacker Tracker schedule export. Explore the live DEF CON 34 schedule at info.defcon.org.
Schedule shape
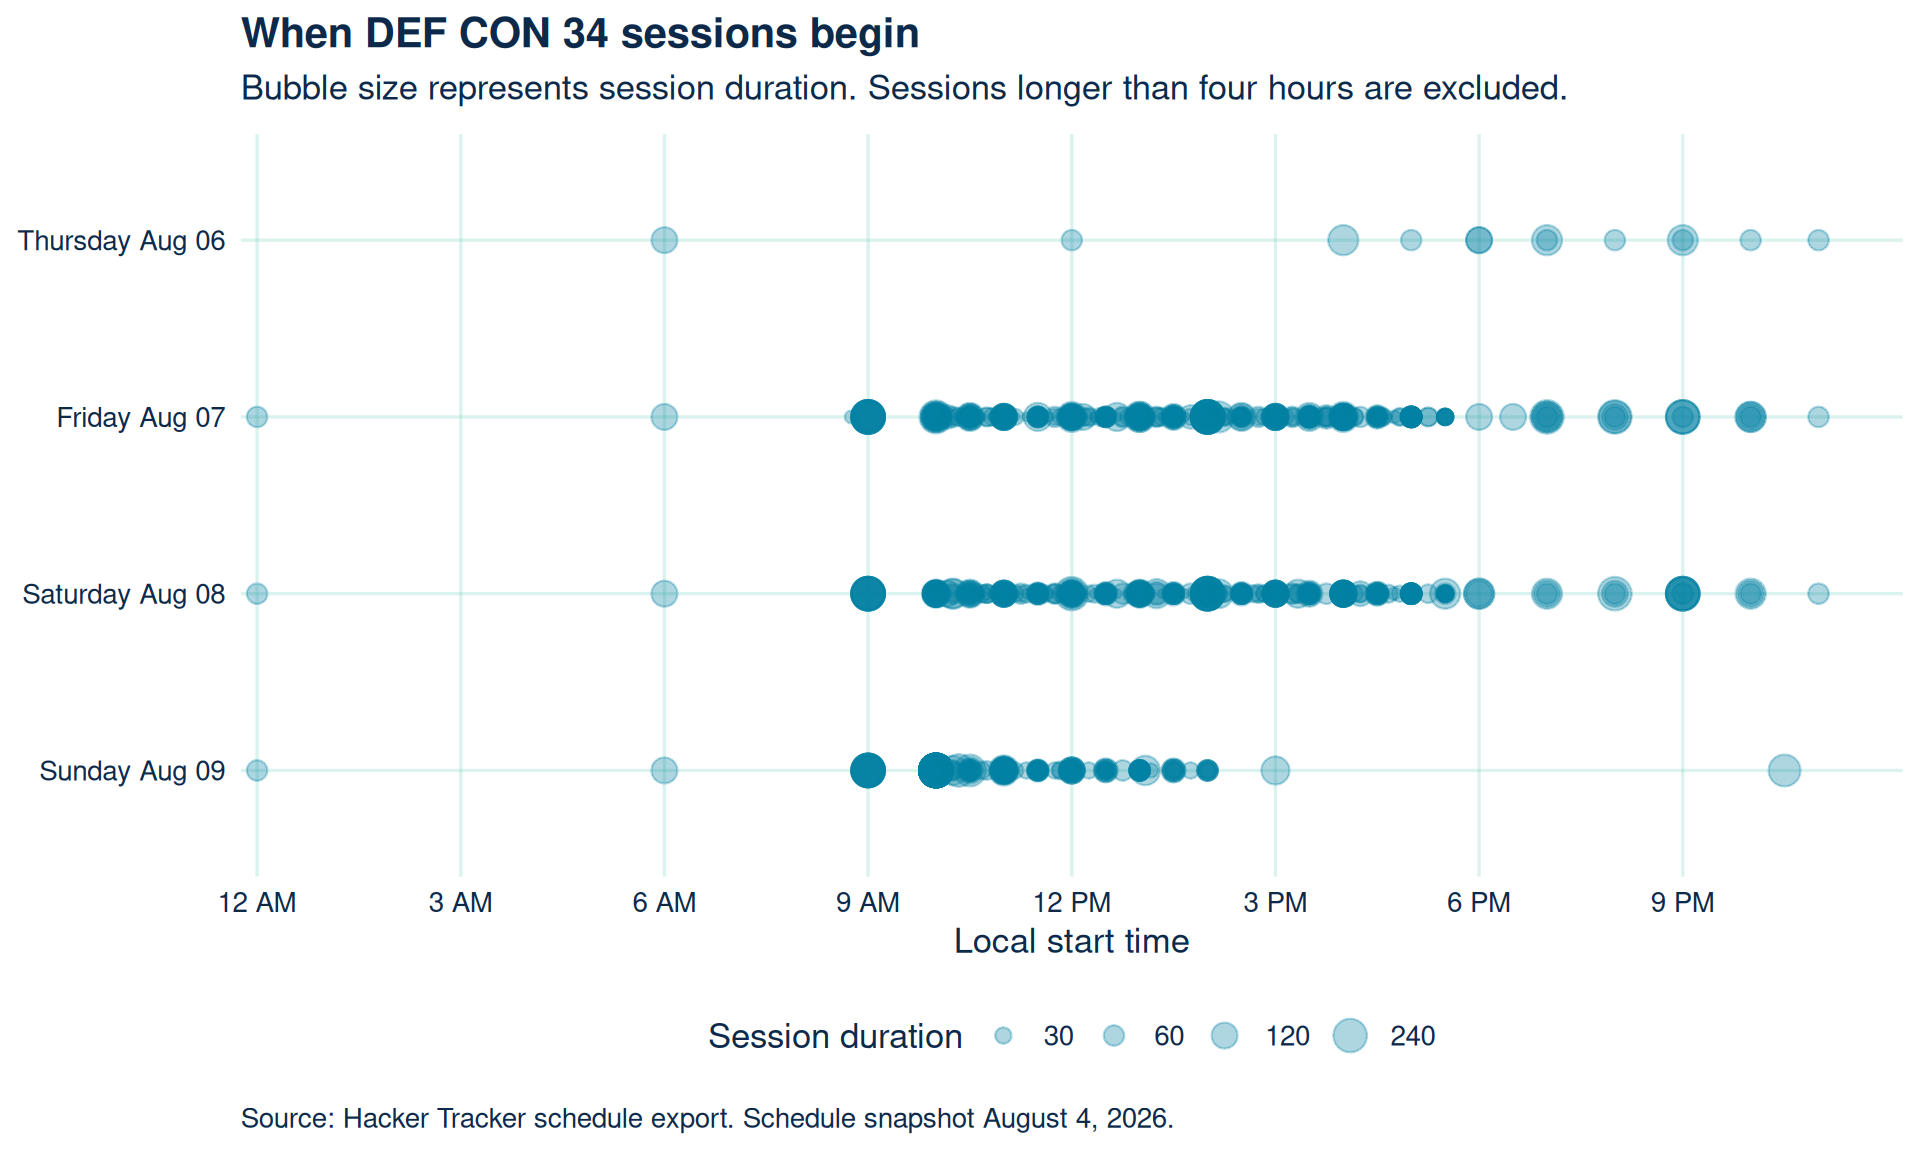
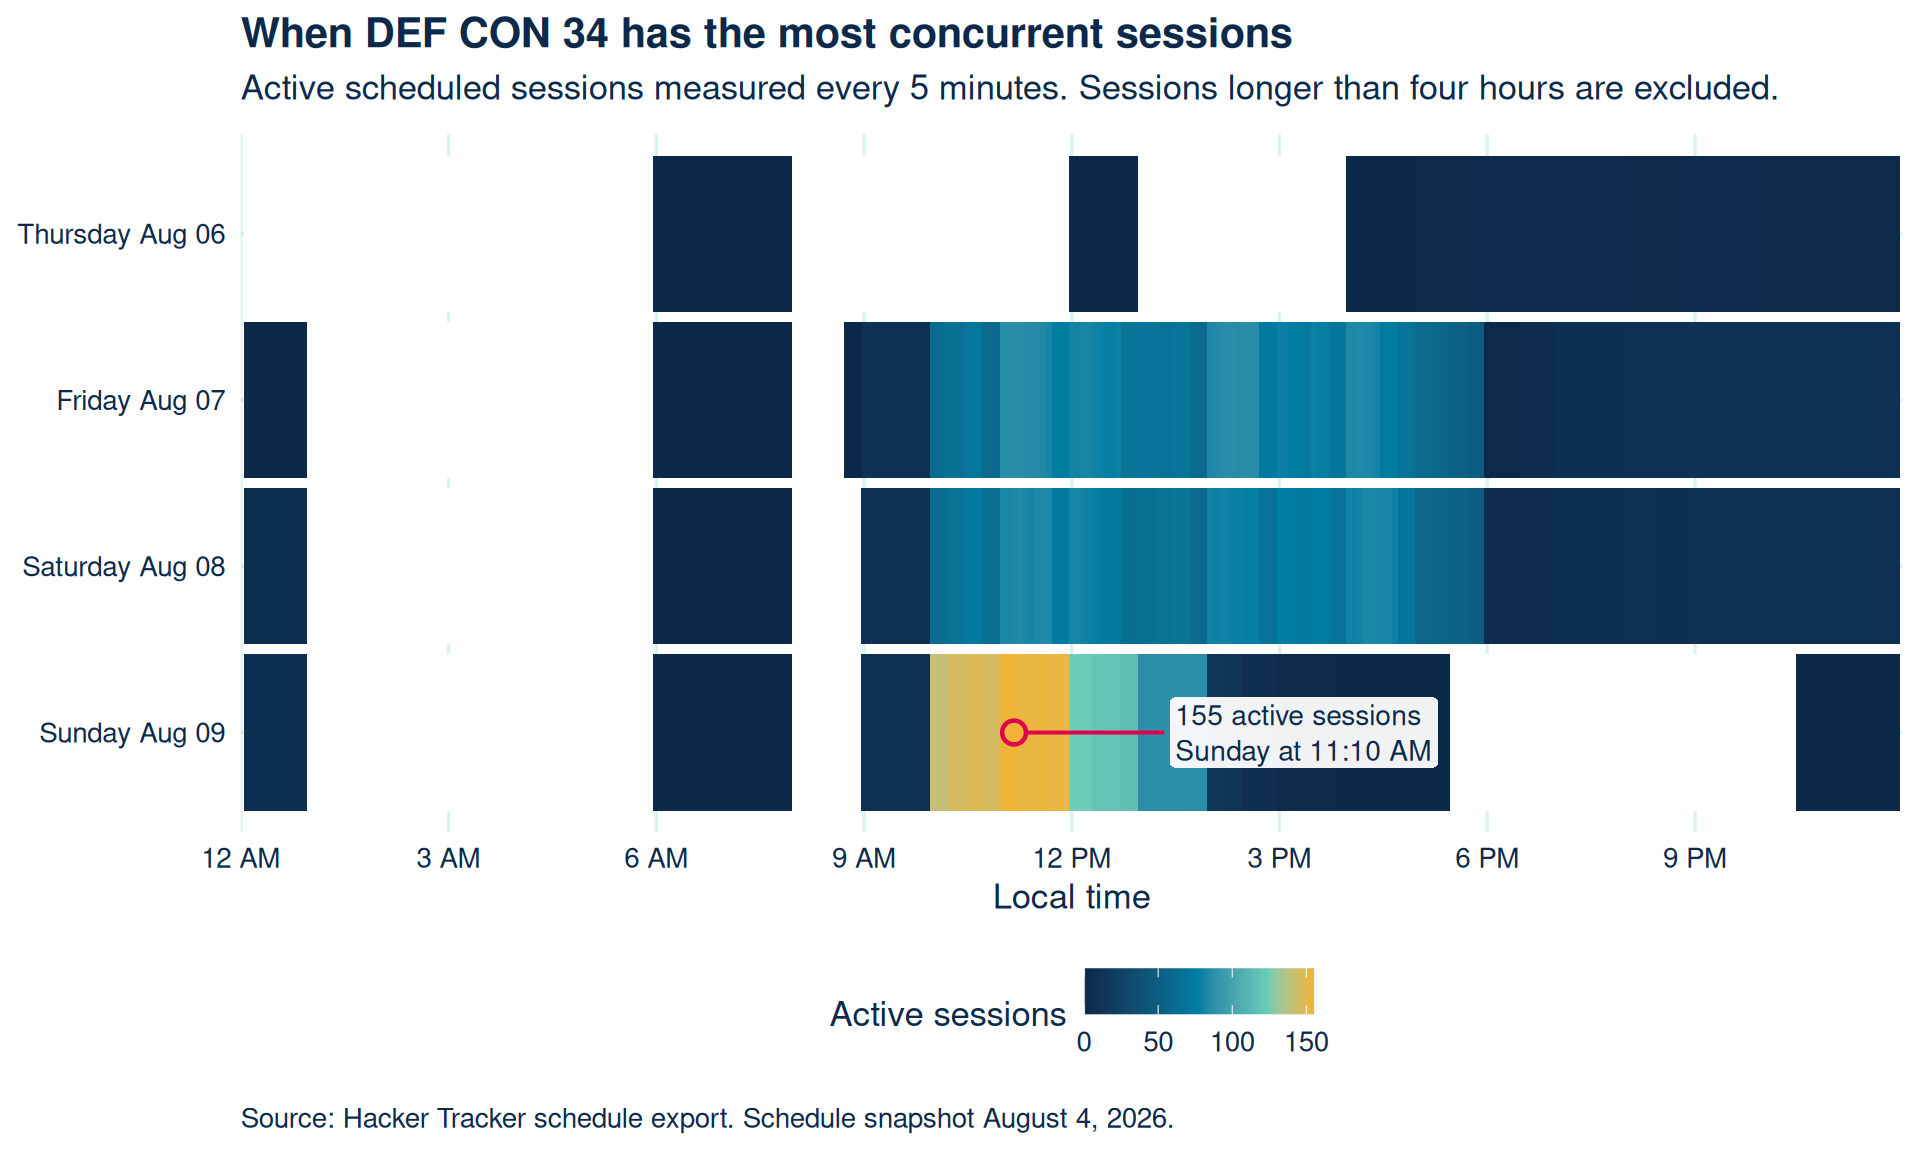
Across five-minute periods with at least one active session, the schedule averages 30.3 concurrent sessions with a median of 8.0.
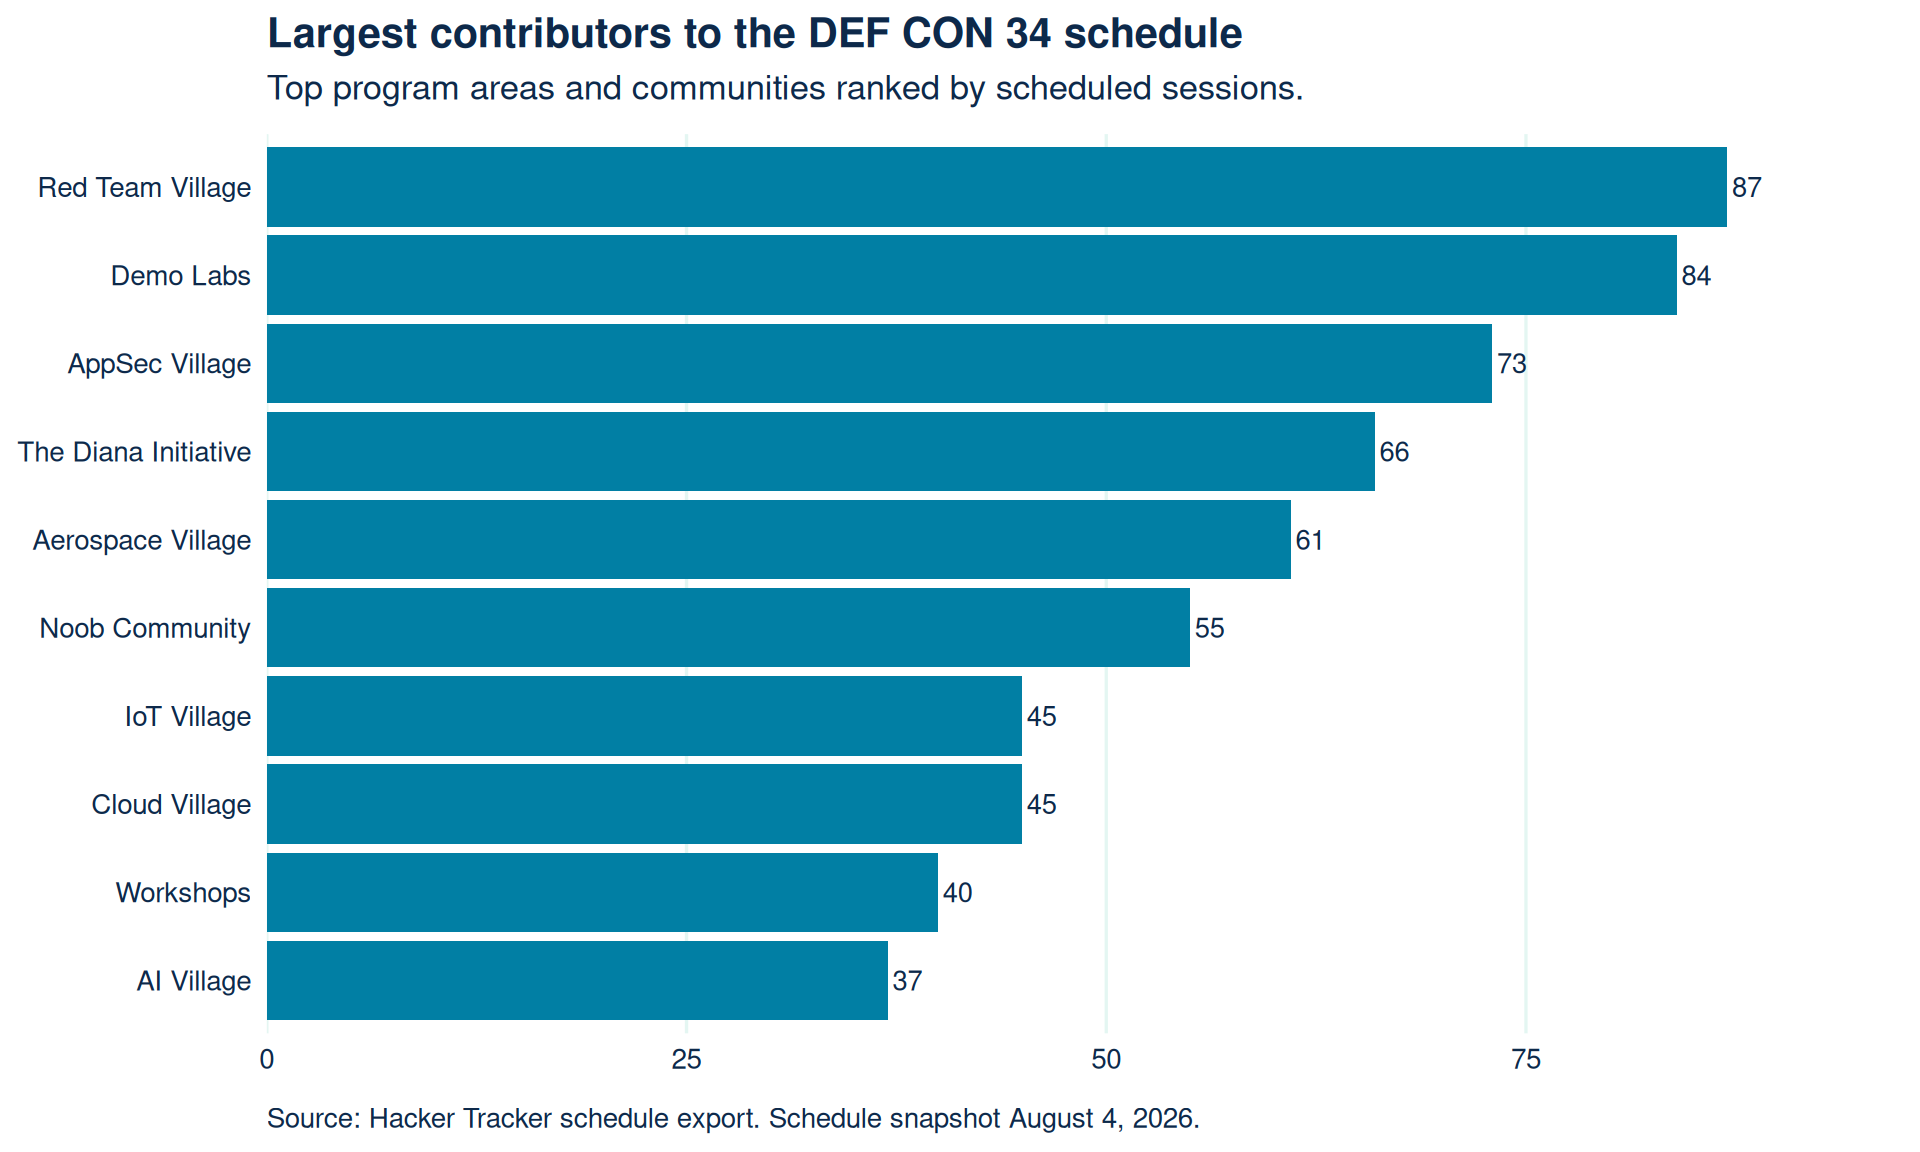
Largest schedule contributors
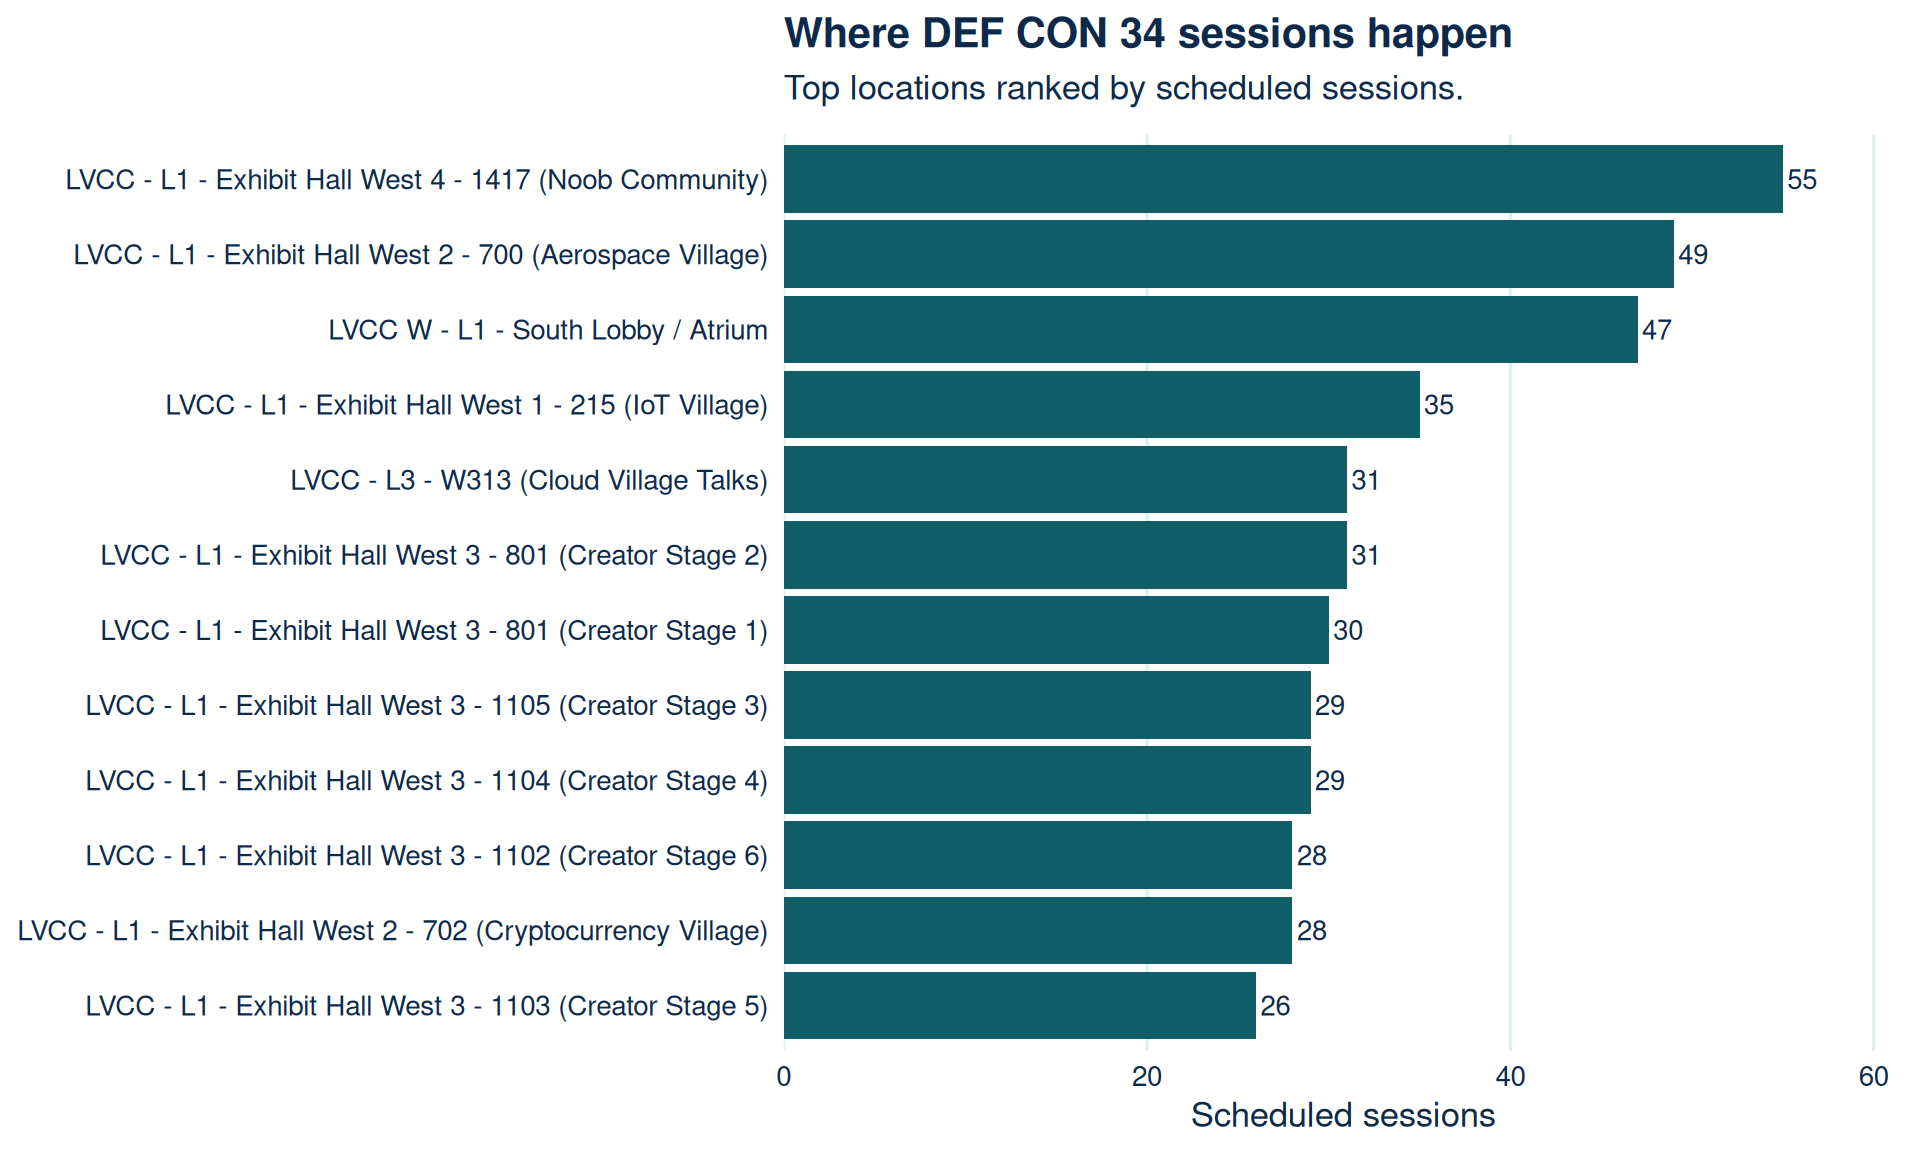
Busiest locations
| Date | Scheduled sessions | Sessions in hour analysis | Session hours |
|---|---|---|---|
| Thursday, August 06 | 19 | 13 | 22 |
| Friday, August 07 | 723 | 587 | 642 |
| Saturday, August 08 | 700 | 579 | 630 |
| Sunday, August 09 | 304 | 293 | 535 |
For richer rankings, see the organization and location tables.